
In today’s world, multiple platforms and media need to be supported. This means that traditional based documentation is becoming more and more irrlevant.
Traditionally, technical illustrations have been produced to support the written word. However, it’s fair to say that the way we create and consume technical information today has changed. More emphasis is now placed on visuals and increasing graphical content - particularly in situations where we can avoid expensive translations costs by making information more graphical.
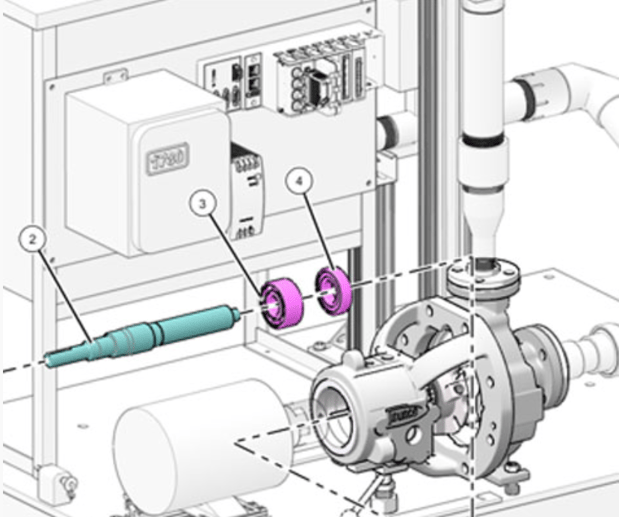
Furthermore, industry also demands that we don’t just create static 2D information anymore. It is increasingly being supplemented and even being replaced by 3D illustrations and animations, which can show the product’s assembly sequence. Sometime it is just a better way to communicate information and the use of 3D can totally transform this experience.
However, organisations today are not typically well placed to leverage the rich 3D content and investment in their design department. Therefore they are unable to easily reuse this content in other departments, such as service and production. This leads to organisations having to recreate technical drawings as digital illustrations from scratch - increasing the total cost of the product development and the inevitable on-going costs of maintaining this material through the product’s lifecycle.
Technical illustration maturity model
One way of looking at how organisations are currently creating and maintaining their technical illustrations is through the maturity adoption model. It describer the different levels that today’s businesses can operate at:
Level 1 - Illustrations are managed on personal or shared hard-drives. The information is disconnected and duplicated from the original CAD data. This means that any changes are not easily propagated through, making information disconnected. Illustrators work in their own departments, with no integration to the host data that actually exists.
Level 2 - Illustrations are managed in a content management system. There is access to the CAD data from the technical team, but it’s still disconnected and the illustrations aren’t connected to the source model. This means they’re still working in their own silo, with some process level integration to the source data. This level is where most companies today exist.
Level 3 - Illustration are managed in a content management system, but there is also a managed association between the sourced CAD model and the technical illustration information. This allows the illustators to more integrated; like a member of a cross-functional team. Integration is key in this case, allowing downstream deliverable to be automatically updated based on the native CAD data itself.
Level 4 - Illustrations are managed in a content management system. At this level, the links between the CAD data and the illustration are fully managed, which enable integration at both a technical and process level. This also makes it possible to bring in other areas of the business, such as engineering and manufacturing to actually take part in these processes.
Sat behind the maturity model are four factors that affect and organisation's ability to progress its technical illusration capabilities:
1 - The organisation's 3D Capabilities and how readily this information can be made
2 - The organisation's CAD Reuse capabilities and how it can make sure that one set of data can be repurposed and re-utilise in many different departments
3 - The Productivity of the internal team's and their abilities to create illustrations and aftermarket material
4 - The propensity for Change Management and understanding how changes also impact on other processes. This is not only on the actual CAD data, but also on the technical illustration data itself
Let us take a look at PTC’s response to the service information delivery challenge. We can see in the below image that it embraces three main themes of service information delivery: Create, Manage and Deliver.
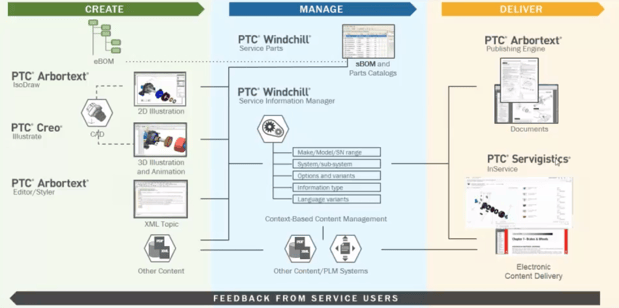
Under the Create section, we have a great suite of tools in the form of PTC Arbortext IsoDraw, for creating your 2D and 3D illustrations, Creo Illustrate, which is what we’ll be focusing on for the purpose of this blog, where you can create your 3D illustrations and animations. There is also PTC Arbortext Editor/Styler, which allows you to create your rich 2D content and automate the build of this.
The Create tools can be supplemented with other tools in the PTC suite, such as PTC Windchill, to manage the content and data, and PTC Arbortext Publishing Engine and PTC Servigistics to build this data together and deliver it in readily available formats.
Combined together, we believe that this creates the industry's most complete integrated solution for creating service and product information. The solutions can be used standalone. But greater value can be obtained by integrating to upstream and downstream solutions.