A new dashboard is shortly being released in Creo Performance Advisor. The Functional Area Usage dashboard (which you will be able to access in the drop down list at the top ofthe programme) will offer you an overview of functionalities that you are currently using in your enterprise.
What are the key feature of the Functional Usage Report?
You will be able to view the top ten functionalities that are being currently used and review those that you own but aren’t currently using. As well, if you have any toolkit customisations, you will also be able to review them and look at the most and least used customisations.
What time frames can you generate reports for?
Functional usage reports can be between 4 and 16 weeks.
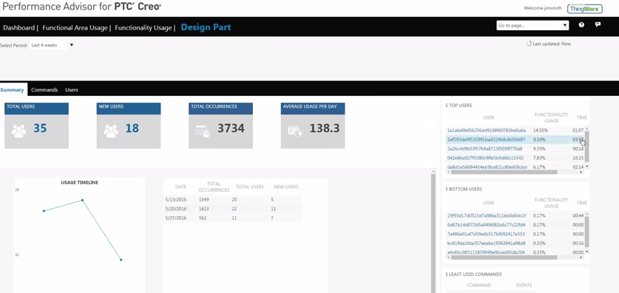
What additional information is available?
Within the functional usage report you will be able to sort through any of the columns. You can also control the display of the report, so this will enable you to look at any functionality that is or is not being used. You can also review which functionality is being used the most.You will also be able to select the individual functionality to see the number of users (including new users), the number of occurrences and the average users per day as well as the top and bottom five users for each functionality. As well, you’ll be able to review the command list and see which are and are not in use.